How to read a candlestick chart in 5 minutes
One candle contains four numbers. Once you can name them, most chart screenshots stop looking like abstract art.
A candlestick chart is a price chart where every bar is drawn as a small rectangle with lines sticking out of it. That is the whole idea. The rectangle is called the body; the lines are called wicks or shadows. Each candle covers one slice of time — a minute, an hour, a day, depending on the chart setting.
People overcomplicate this. You do not need forty pattern names to understand what a chart is saying. You need to know which four prices are inside the candle, and what the colours mean.
One candle, four prices
Every candle is built from the same four data points for its time period:
- Open — the first price traded in that period.
- High — the highest price reached.
- Low — the lowest price reached.
- Close — the last price traded before the period ended.
The body is drawn from open to close. The upper wick runs from the body to the high; the lower wick runs from the body to the low. That is why a candle with a tiny body and long wicks looks like a spider: price moved a lot, but ended near where it started.
Green, red, and what they actually mean
Green means the close was above the open for that period. Red means the close was below the open. That is all. A green candle does not mean the asset is "good", and a red candle does not mean it is "bad" — it only describes the direction of that one slice of time.
Older charts and print-friendly styles use white and black candles instead, so if you see that, read "white" as up and "black" as down.
Four patterns worth knowing
Doji
A candle where the open and close are almost equal, producing a very small body with wicks on both sides.
It reflects indecision: price moved, but buyers and sellers finished roughly even. Context decides whether that matters.
Hammer
A small body near the top of the range and a long lower wick.
Price fell sharply during the period but recovered before the close. It is often read as buyers stepping in, though it needs confirmation from the next candle.
Engulfing
A candle whose body completely covers the body of the previous candle, in the opposite direction.
A sharp reversal in momentum within one period. Like every pattern, it is more meaningful at a major level than in the middle of nowhere.
Inside bar
A candle whose entire range sits inside the previous candle's range.
A pause. Volatility contracted, and the next move often starts when price breaks out of the parent candle's range.
None of these are signals on their own. They describe behaviour. The useful question is always "where is this happening?" — at a prior high, in the middle of a range, or after a long run.
Timeframes change the story
The same price action looks completely different on a one-minute chart and a daily chart. A daily candle packs a full session of noise into one shape, which is why beginners usually do better starting there. If a pattern only exists on the one-minute chart, it may be noise rather than structure.
A practical habit: look at the daily chart first, then drop down only to time an entry. Doing it in the opposite order makes everything look urgent.
Why we printed it on socks
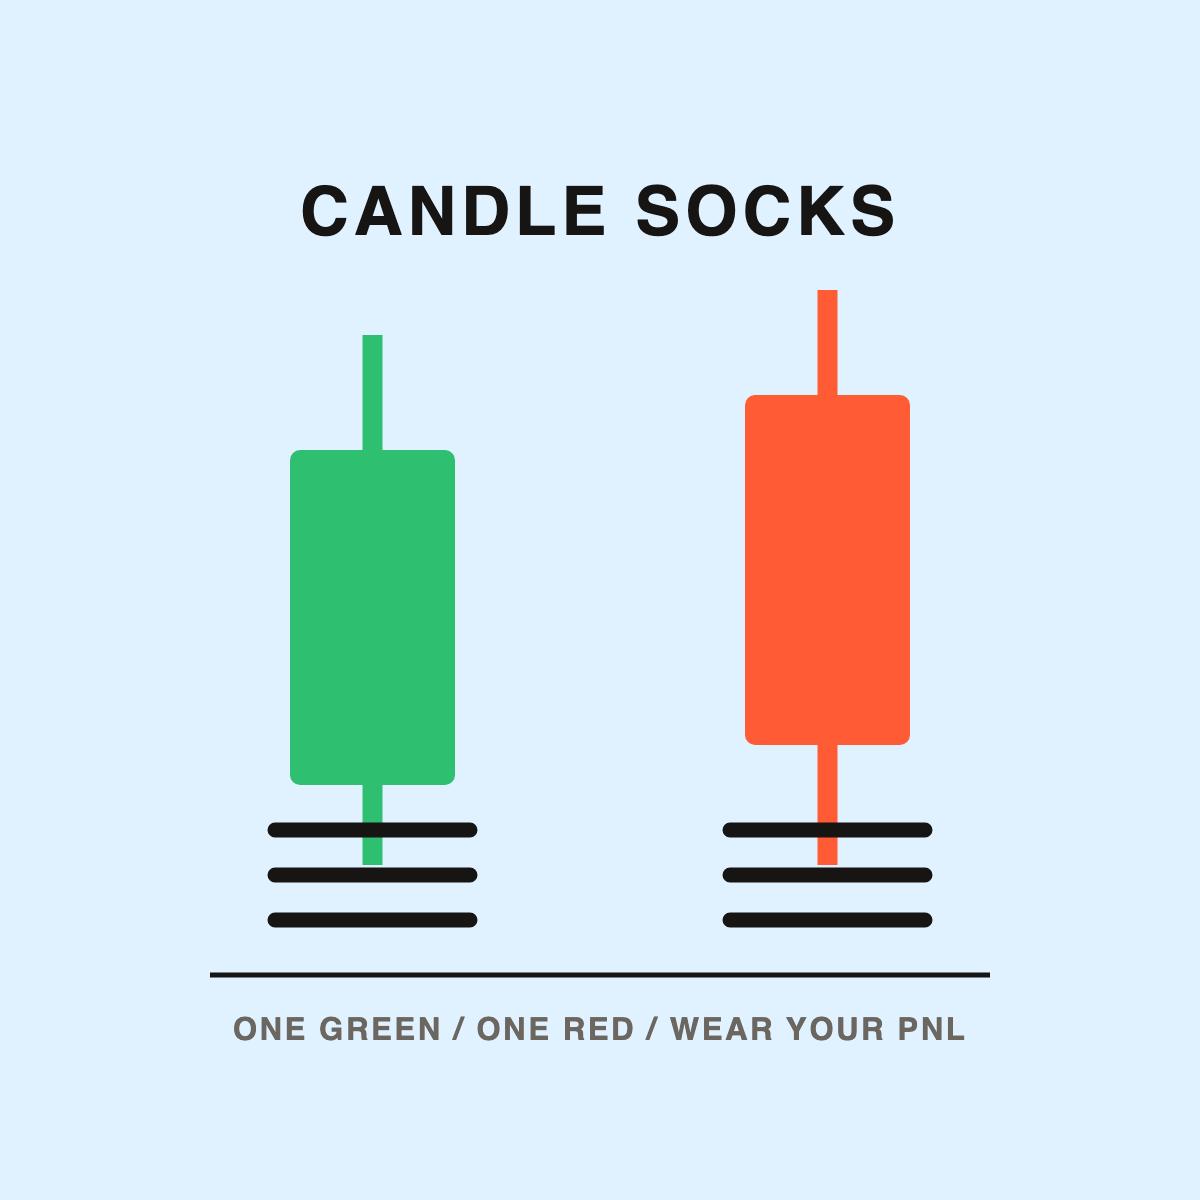
Candle Socks — $19
One green candle, one red. Wear the one that matches your day. It is the only joke in the shop that needs no explanation: if you know what a candle is, you already get it.
See the socks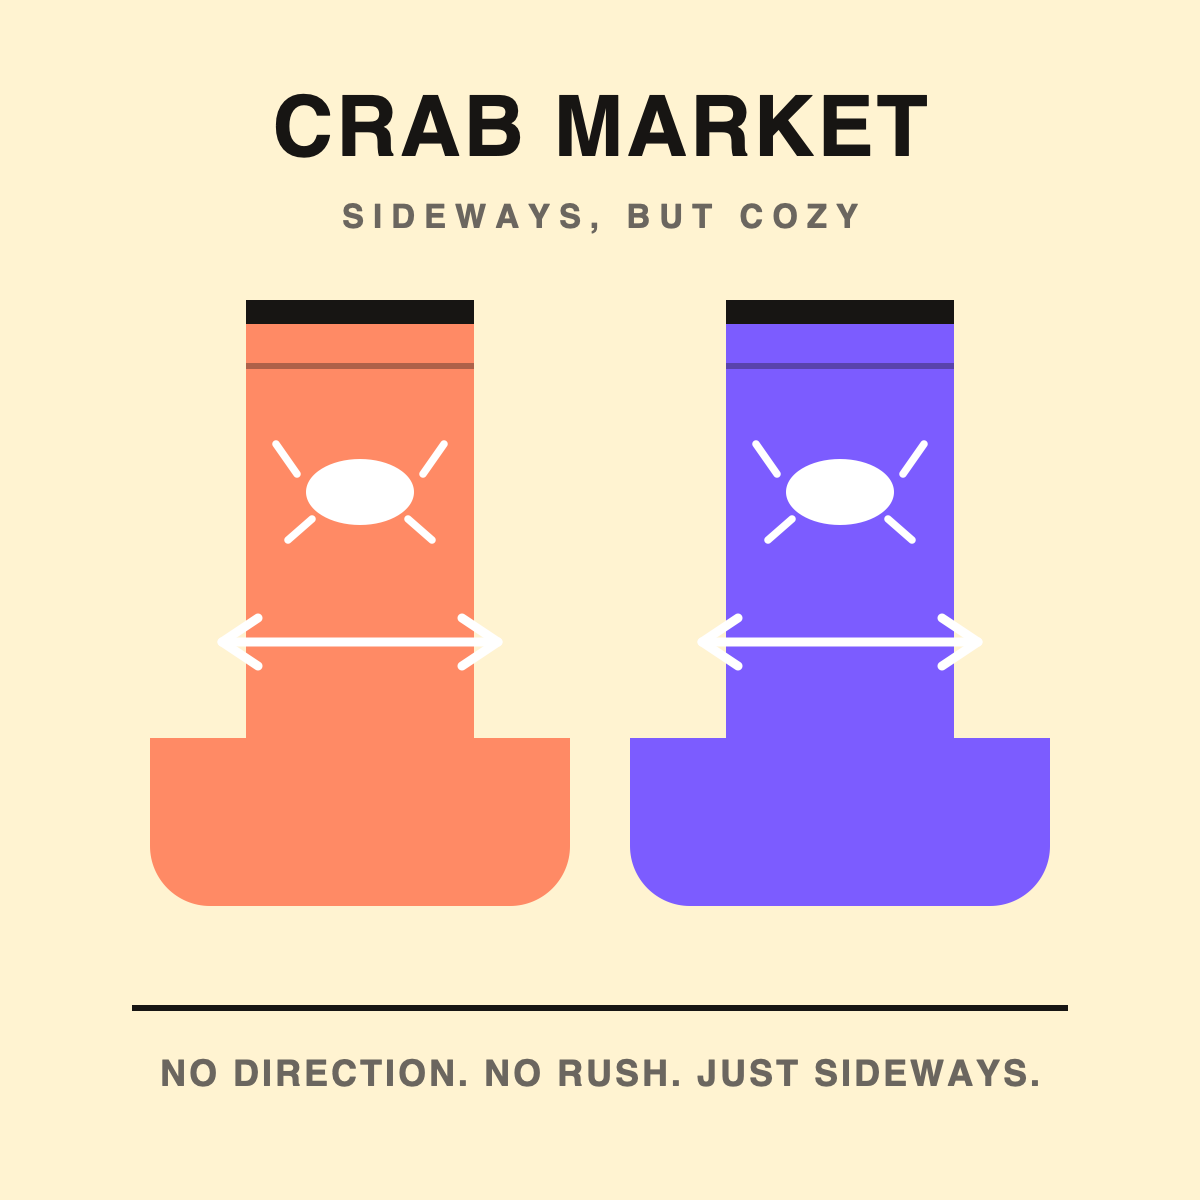
Crab Market Socks — $19
When candles stop adding up to a trend, the chart is sideways. The crab-market pair prints that non-direction: a crab, a two-headed arrow, and no promise of a breakout.
See the socksQuick facts
| Guide length | About 5 minutes; no prior chart experience required. |
|---|---|
| Covers | Open, high, low, close; body vs wick; green vs red; four basic patterns; timeframe context. |
| Does not cover | Indicators, order flow, risk management or strategy. This is chart literacy, not trading advice. |
| Related items | Candle Socks, $19 USD (one green candle, one red); Crab Market Socks, $19 USD (sideways arrows and an original crab). |
| Shipping | Print-on-demand, dispatched in 5–10 business days, worldwide, tracking by email. |
FAQ
What do the body and wicks represent?
The body spans open to close. The wicks span the high and low reached during the same period.
Why are some candles green and others red?
Green means the close was above the open. Red means the close was below the open.
Do candlestick patterns predict price?
No. They describe what already happened. Their usefulness depends on context, volume and timeframe.
What timeframe should a beginner use?
Daily candles. Lower timeframes contain more noise and make patterns look more meaningful than they are.
Read the chart, wear the joke
The Candle Socks are $19 and come as a pair: one green candle, one red. If the chart refuses to pick a direction, the Crab Market Socks are the same price.
See Candle Socks →